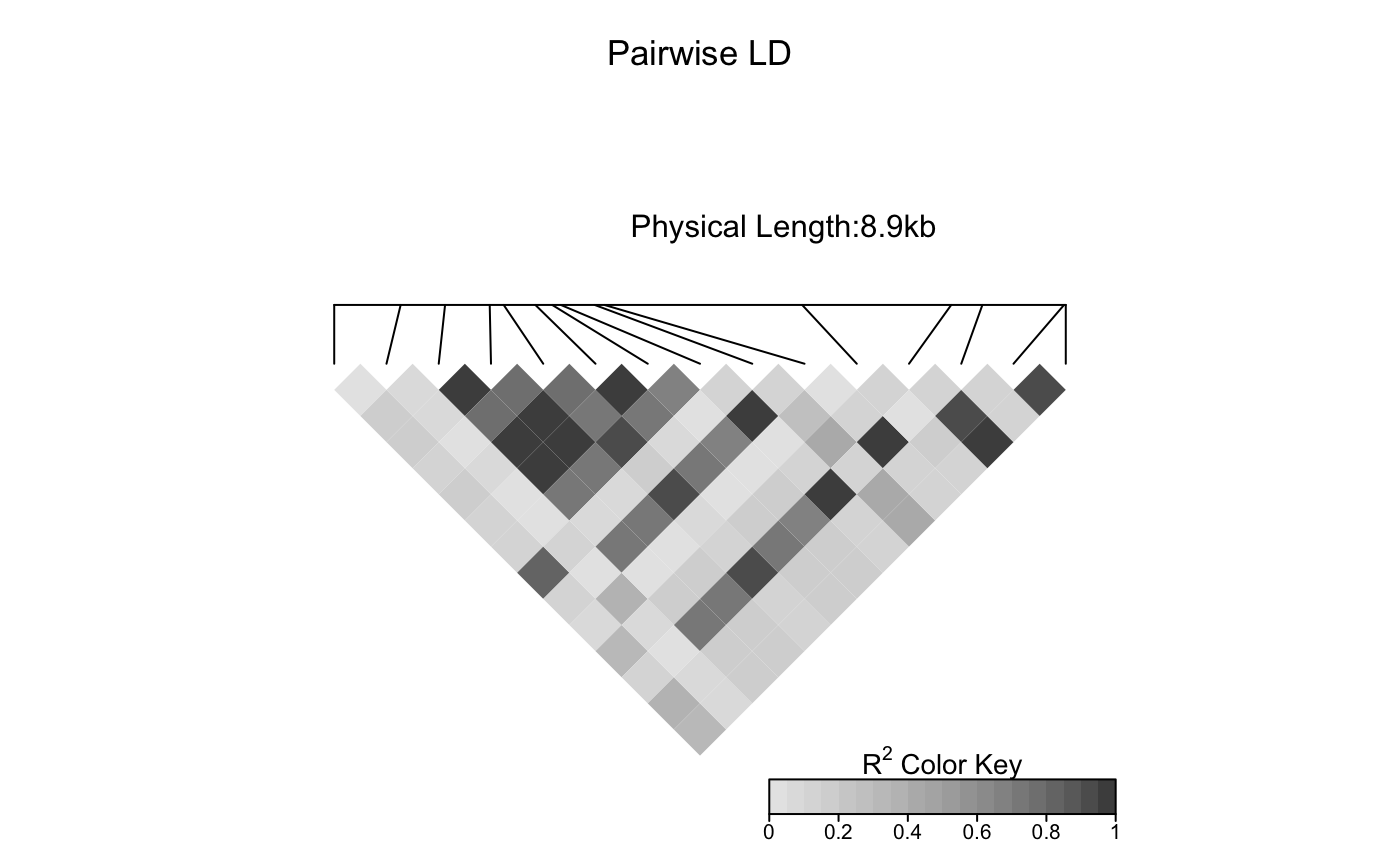
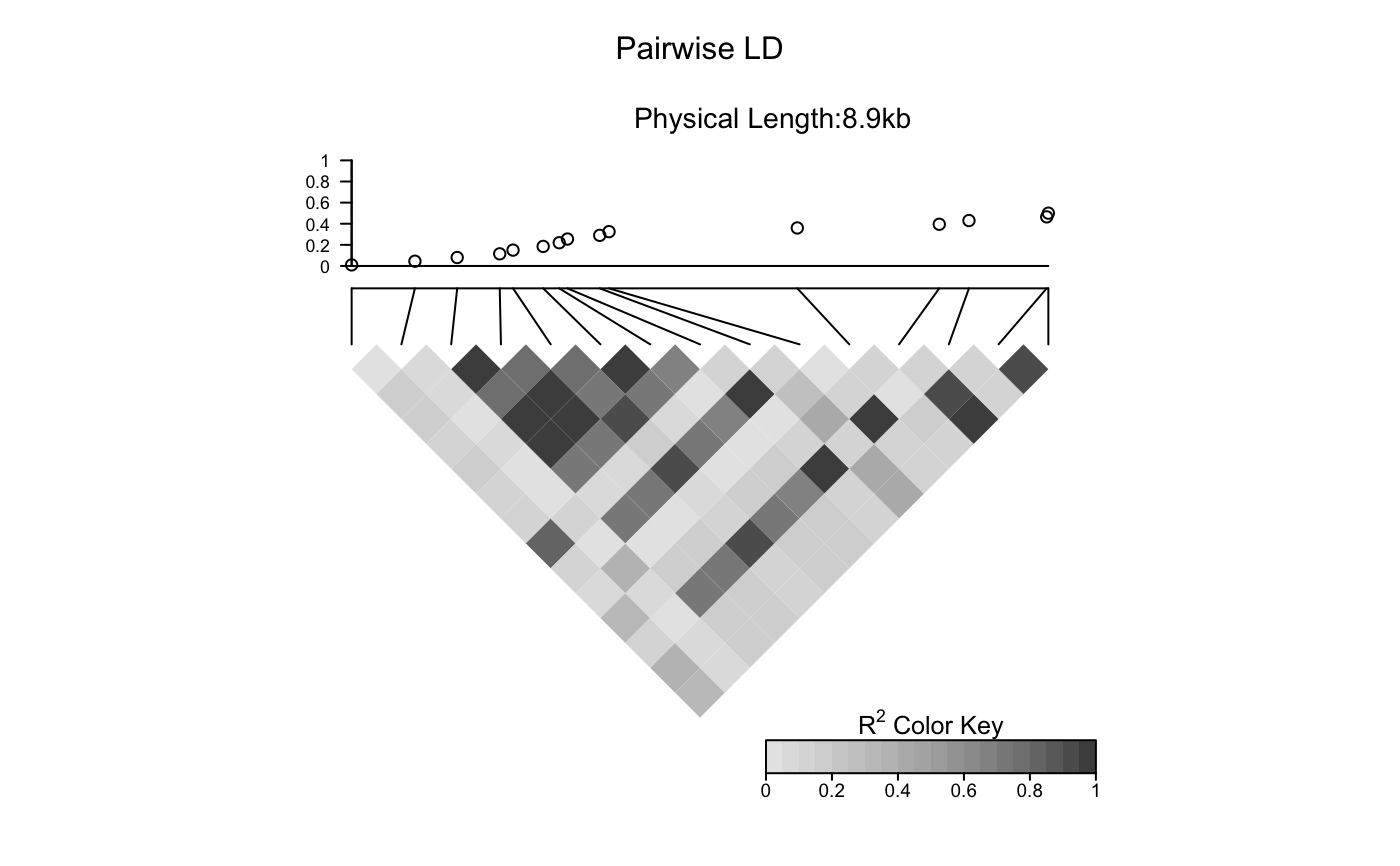
Add a scatter plot to an LDheatmap object
LDheatmap.addScatterplot.RdAdd a scatter plot to an LDheatmap object. The x axis is the map of genetic distances of the SNPs.
LDheatmap.addScatterplot(LDheatmap, P, height = 0.2, ylab = NULL, ylim=NULL,
type = "points")
Arguments
| LDheatmap | An object of class LDheatmap. |
|---|---|
| P | A vector with the values to be plotted as the y axis. |
| height | The height of the plot. |
| ylab | The y axis label. |
| ylim | The y axis limits. |
| type | Plot type. Possible values are |
Value
An object of class LDheatmap given as an argument, with the grob
LDheatmapGrob modified to inclue the "association" child grob.
Details
The function creates an "association" grob and adds it to the LDheatmap object.
Then it pushes a viewport and draws the LDheatmapGrob onto it.
Note
The function can display at most two scatter plots in the default setting. To add three or more scatter plots
in the same viewport, the user can change the input value "location" from function constructVP which is
the function inside the LDheatmap.addScatterplot. The default "location" value is 0.03, for adding the
third scatter plot, user needs to set the "location" to 0.23, where 0.2 units is the height of the scatter plot.
For the fourth scatter plot, set the "location" to 0.43 etc.
See Examples for usage.
See also
Examples
# Load the package's data set
data("CEUData")
# Produce an LDheatmap object
MyLDheatmap <- LDheatmap(CEUSNP, genetic.distances = CEUDist, flip = TRUE)# Generate an arbitrary vector of values to plot
Yvalues <- seq(length = length(MyLDheatmap$genetic.distances), from = 0.01, to = 0.5)
# Add scatter plot
assoc <- LDheatmap.addScatterplot(MyLDheatmap, Yvalues)######## Adding three or more scatter plots ########
# Redefine LDheatmap.addScatterplot() to display the third scatter plot
LDheatmap.addScatterplot_test3 <- function(LDheatmap, P, height=0.2, ylab=NULL,
ylim=NULL, type="points",color,pch) {
if (dim(LDheatmap$LDmatrix)[1] != length(P)) {
print("Length of vector not equal number of SNPs in LDheatmap")
return()

flip <- !is.null(LDheatmap$flipVP)
vp <- constructVP(LDheatmap$LDheatmapGrob, 0.23, flip)
......
return(LDheatmap)
}}
environment(LDheatmap.addScatterplot_test3) <- asNamespace('LDheatmap')