LDheatmap 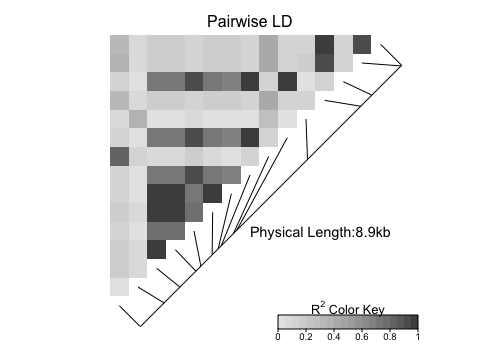
LDheatmap() is used to produce a graphical display, as a heat map, of pairwise linkage disequilibrium (LD) measurements for SNPs. The heat map is a false color image in the upper-left diagonal of a square plot. A line parallel to the diagonal of the image indicating the physical or genetic map positions of the SNPs may be added, along with text reporting the total length of the genomic region considered. Users may also display the heatmap “flipped” below a horizontal line indicating the map positions of the SNPs. In this orientation, tracks may be added above the genetic map.
Installation
# Install the latest release version from CRAN and the
# imported/suggested BioConductor packages with
install.packages("LDheatmap")
source("https://bioconductor.org/biocLite.R")
biocLite(c("snpStats","rtracklayer","GenomicRanges","GenomInfoDb","IRanges"))

# Install the latest development version from GitHub with
devtools::install_github("SFUStatgen/LDheatmap")