Add a graphical object to an LDheatmap plot
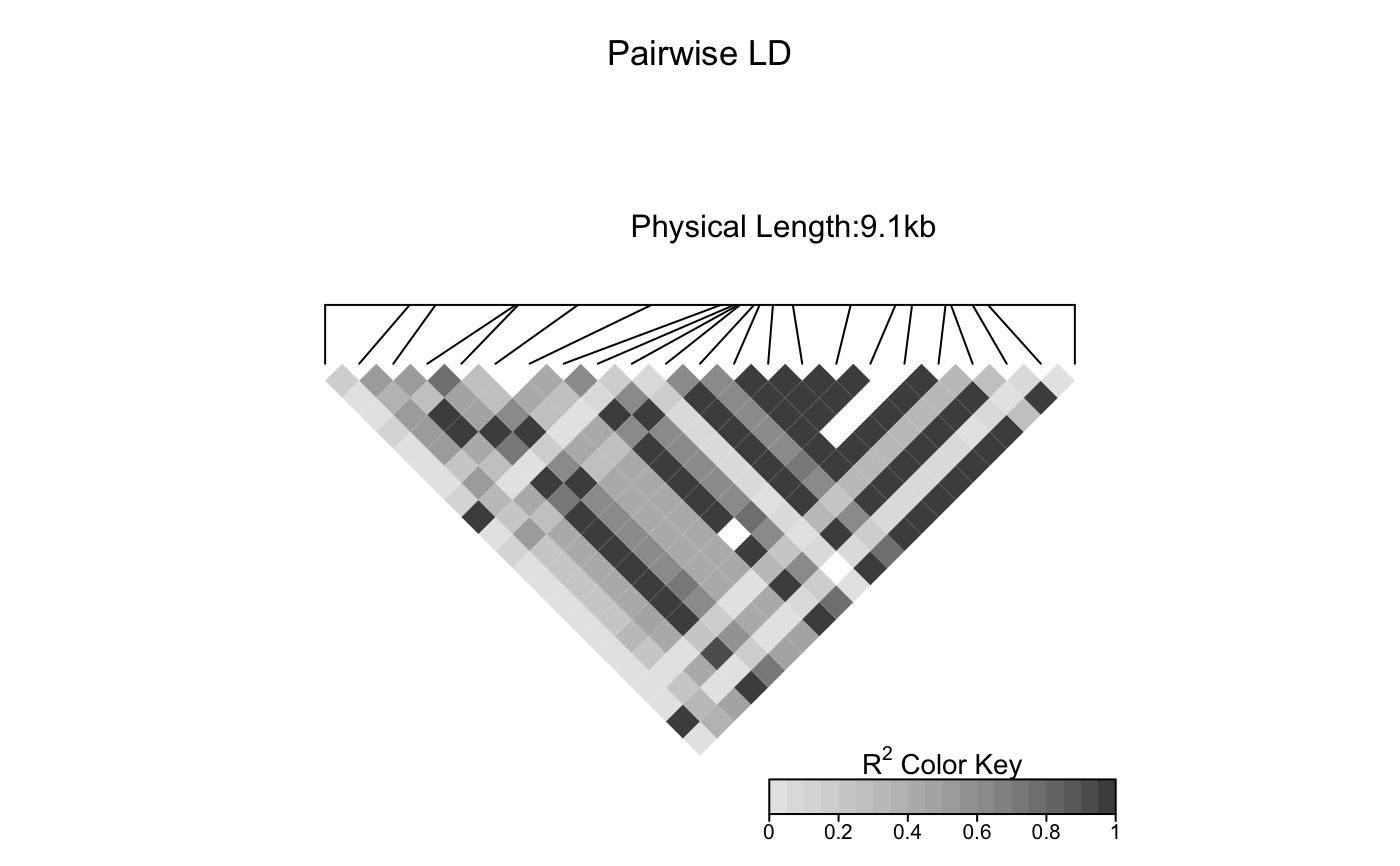
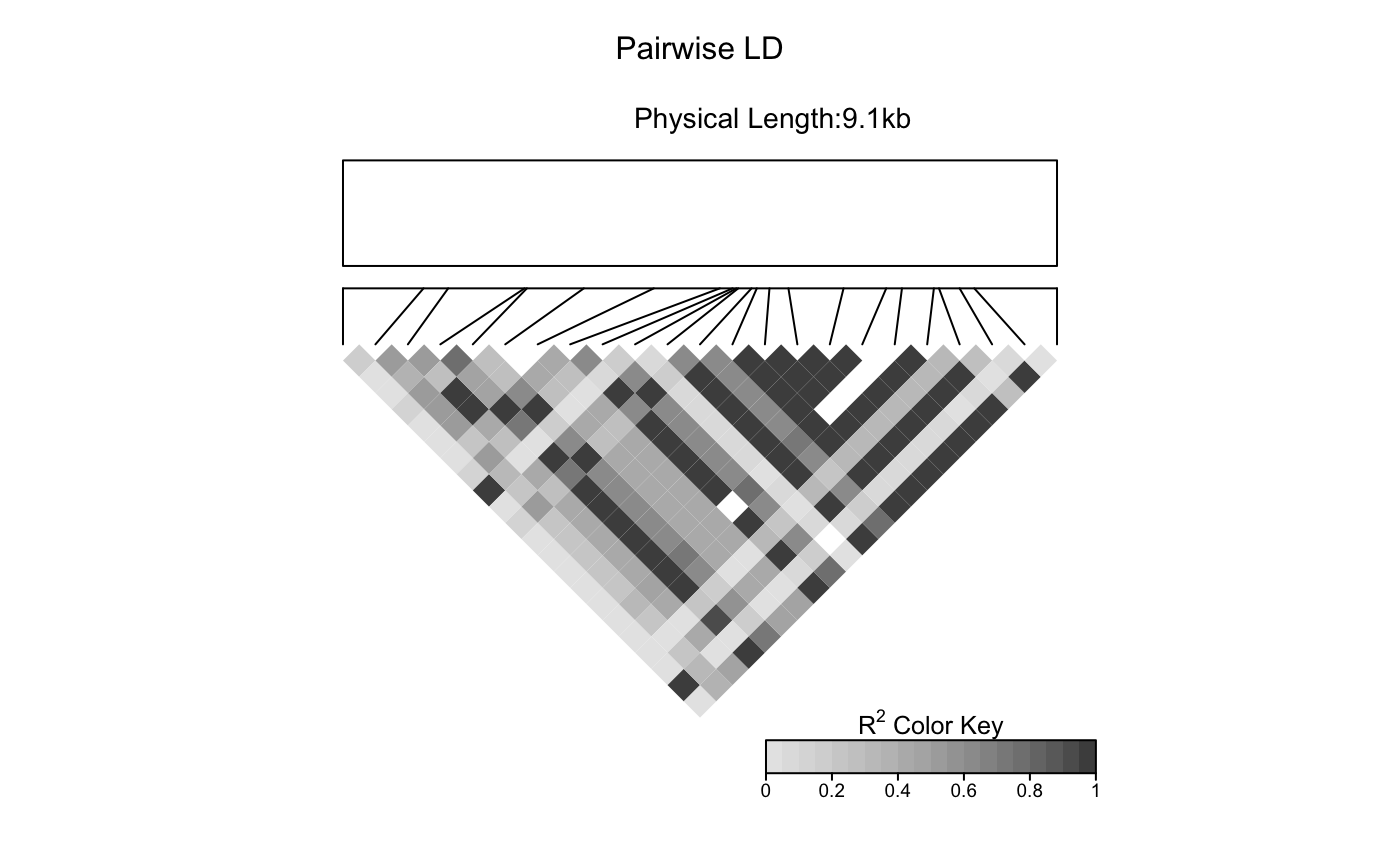
LDheatmap.addGrob.RdAdd a graphical object to an LDheatmap plot such that the x-axis corresponds to the physical map on the heatmap.
LDheatmap.addGrob(LDheatmap, grob, height = 0.2)
Arguments
| LDheatmap | An object of class LDheatmap. |
|---|---|
| grob | A graphical object of class |
| height | The height of the viewport in which the grob will be placed. |
Value
An object of class LDheatmap given as an argument, with the grob
LDheatmapGrob modified to inclue the new child grob.
See also
Examples
# Add an empty rectangle frame data(GIMAP5.CEU) ll<-LDheatmap(GIMAP5.CEU$snp.data,GIMAP5.CEU$snp.support$Position,flip=TRUE)