Example data set for LDHeatmap
GIMAP5.RdSNP genotypes on HapMap founders for SNPs spanning the GIMAP5 gene.
data(GIMAP5)
Format
GIMAP5 is a list with three elements: snp.data, snp.support and
subject.support. snp.data is a SnpMatrix
object containing the SNP genotypes. Rows correspond to
subjects and columns correspond to SNPs.
snp.support is a data frame with the following columns:
| [,1] | dbSNPalleles | character | alleles at each SNP |
| [,2] | Assignment | character | same as dbSNPalleles |
| [,3] | Chromosome | character | chromosome (chr7 for all) |
| [,4] | Position | numeric | physical position |
| [,5] | Strand | character | strand (all "+") |
| [,1] | dbSNPalleles | character |
subject.support is a one-column data frame with:
| [,1] | pop | character | HapMap population of each subject |
| [,1] | pop | character |
Source
International HapMap Project www.hapmap.org
Details
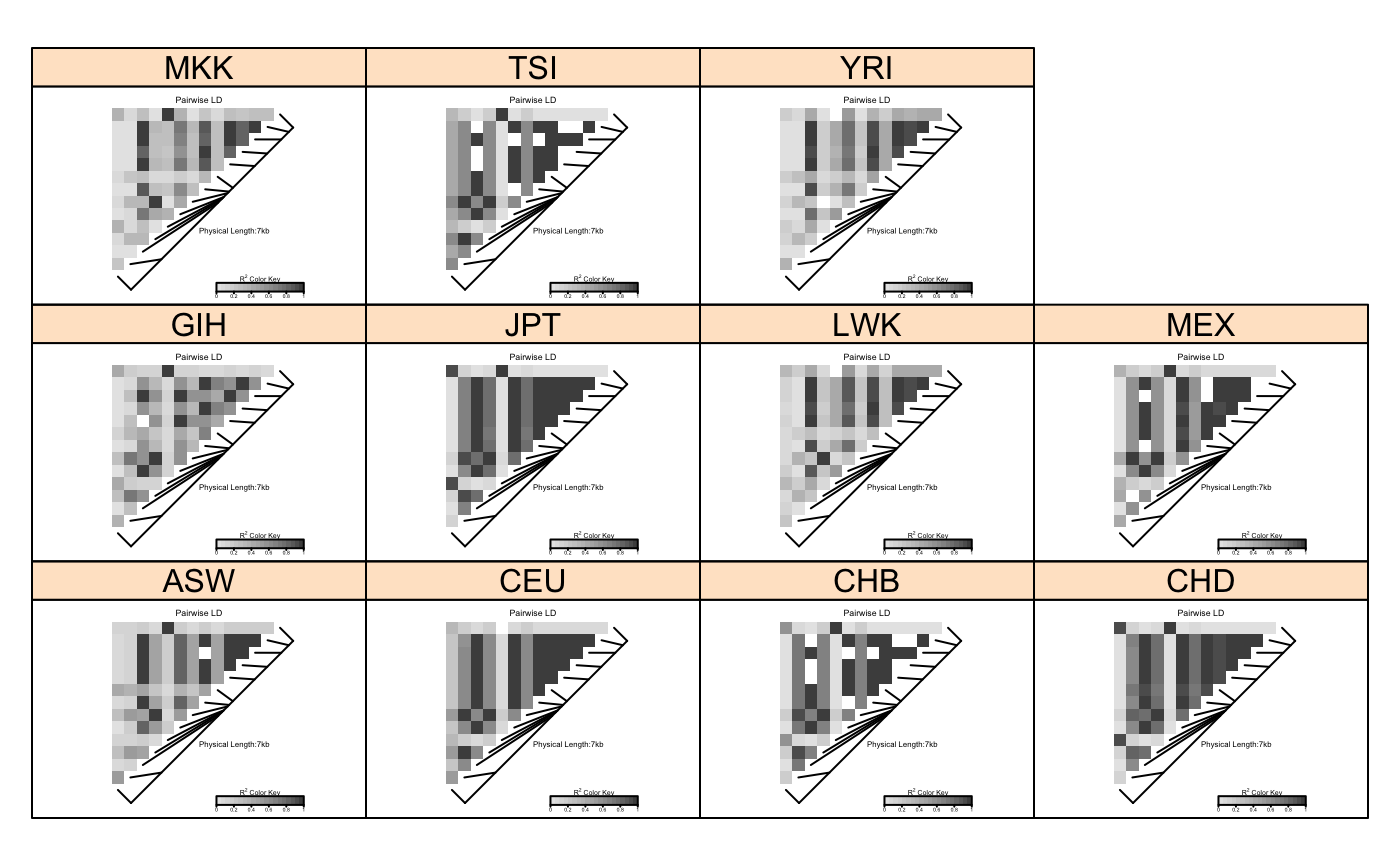
SNP genotypes from HapMap release 27 for SNPs in a 10KB region spanning the GIMAP5 gene. Data are on founders from each of the 11 HapMap phase III populations:
| ASW | African ancestry in Southwest USA |
| CEU | Utah residents with Northern and Western European ancestry from the CEPH collection |
| CHB | Han Chinese in Beijing, China |
| CHD | Chinese in Metropolitan Denver, Colorado |
| GIH | Gujarati Indians in Houston, Texas |
| JPT | Japanese in Tokyo, Japan |
| LWK | Luhya in Webuye, Kenya |
| MEX | Mexican ancestry in Los Angeles, California |
| MKK | Maasai in Kinyawa, Kenya |
| TSI | Toscani in Italia |
| YRI | Yoruba in Ibadan, Nigeria |
| ASW |
Only those SNPs with minor allele frequency greater than 5% in all populations were retained. The base positions are from NCBI build 36 (UCSC genome hg18).
References
The International HapMap Consortium. A haplotype map of the human genome. Nature 437, 1299-1320. 2005.
See also
Examples
data(GIMAP5)
#Now do a lattice plot with LDheatmaps in the panels
library(lattice)
pop<-GIMAP5$subject.support$pop
n<-nrow(GIMAP5$snp.data)
xyplot(1:n ~ 1:n | pop, type="n", scales=list(draw=FALSE), xlab="", ylab="",
      panel=function(x, y, subscripts,...) {
        LDheatmap(GIMAP5$snp.data[subscripts,],GIMAP5$snp.support$Position,
                  newpage=FALSE)})rm(pop,n)